Latest KS2 Results
We are very pleased that once again our pupils have produced a very strong set of KS2 test data. The details are listed below alongside comparison with national data.
2024
|
ARE/EXS Meeting Expected Standard |
NBJS EXS/AS |
National EXS/AS |
Hampshire EXS/AS |
Difference between NBJS vs National |
|
Reading
|
79.8% |
74% |
74.4% |
+5.8% |
|
Writing
|
83.1% |
72% |
71.9% |
+ 11.1% |
|
Maths
|
77.5% |
73% |
72.2% |
+4.5% |
|
Grammar
|
80.9% |
72% |
70.1% |
+8.9% |
|
Combined
|
67.4% |
61% |
59.6% |
+6.4% |
|
Science
|
93% |
81% |
TBC |
+12% |
Key Stage 2 Data from May 2024 SATs testing
North Baddesley Junior School versus National data
(Source = DfE provisional data)
|
Greater Depth Higher end of expectation.
|
NBJS GD |
Hampshire GD |
Difference between NBJS vs Hampshire |
|
Reading
|
39.3% |
29.1% |
+10.2% |
|
Writing
|
19.1% |
13.7% |
+5.4% |
|
Maths
|
29.2% |
21.9% |
+7.3% |
|
Grammar
|
38.2% |
29.2% |
+9% |
|
Combined
|
16.9% |
8.2% |
+8.7% |

|
|
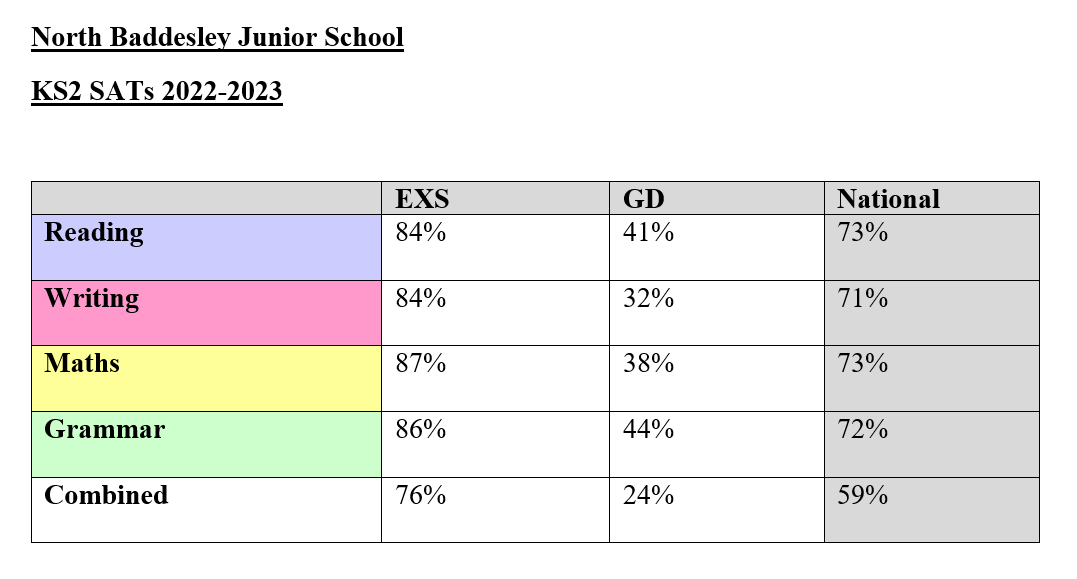
North Baddesley Junior School 2023 |
National 2023 |
NBJS V National |
|
Average progress score in Reading |
0.94 |
|
|
|
Average progress score in Writing |
1.76 |
|
|
|
Average progress score in Maths |
1.33 |
|
|
|
|
|
|
|
|
Average Scaled Score in Reading |
108 |
105 |
+3 |
|
Percentage of pupils who achieved the expected standard in Reading |
84.1% |
73% |
+ 10.1% |
|
Percentage of pupils who achieved a high level of attainment in Reading |
41.3% |
|
|
|
|
|
|
|
|
Percentage of pupils who achieved the expected standard in Writing |
84.1% |
71% |
+13.1% |
|
Percentage of pupils who achieved a high level of attainment in Writing |
31.7% |
|
|
|
|
|
|
|
|
Average Scaled Score in Maths |
107 |
104 |
+3 |
|
Percentage of pupils who achieved the expected standard in Maths |
87.3% |
73% |
+14.3% |
|
Percentage of pupils who achieved a high level of attainment in Maths |
38.1% |
|
|
|
|
|
|
|
|
Average Scaled Score in Grammar, Punctuation & Spelling |
108 |
105 |
+3 |
|
Percentage of pupils who achieved the expected standard in Grammar, Punctuation & Spelling |
86% |
72% |
+14% |
|
Percentage of pupils who achieved a high level of attainment in Grammar, Punctuation & Spelling |
44% |
|
|
|
|
|
|
|
|
Percentage of children meeting the expected standard in reading, writing and maths combined |
76.2% |
59% |
+17.2% |
|
Percentage of children achieving a high standard in reading, writing and maths combined |
23.8% |
8% |
+15.8% |
*0 is the expected level of progress (i.e. met progress expectation). A positive number is greater than expected, a negative number means less than expected progress.
-
What do the new progress measures mean?
DfE leaflet which explains what the progress measure means. A score of 0 implies pupils make roughly the same progress as similar school. A score greater than 0 indicates better progress than typical.
